
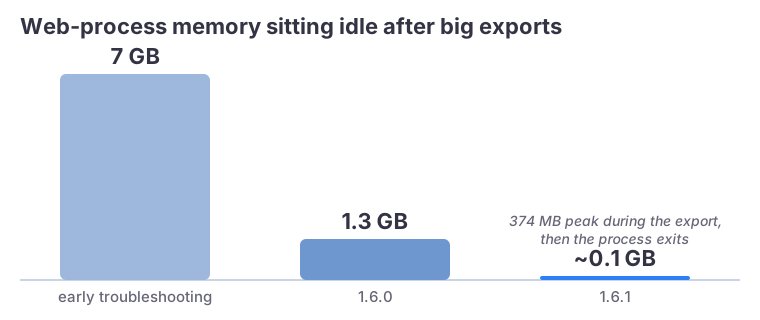
After the export engine was fixed, a tester sent a screenshot: the app's web content helper sitting at 1.3 GB of memory, hours after the exports finished. Earlier versions had reached 7 GB. Nothing was leaking in the usual sense; the numbers just never came back down. This chapter is the week it took to understand why, and the slightly absurd place the fix ended up.
The suspect list, eliminated one by one
We built a standalone probe harness that drives a WKWebView exactly like our print pipeline does and measures the web content process across passes. What it established, with numbers rather than vibes:
- The print pipeline itself was clean after the export fixes: about 1 MB per pass.
- Growth tracked content churn, and images dominated it (roughly 80 percent).
- Nothing reclaimed it. Not emptying the DOM, not the memory-cache purge API, not the one garbage-collection hook WebKit exposes, not 45 seconds of idle.
- The smoking gun: forcing 240 MB of short-lived JS allocations made the process permanently bigger. The freed memory's pages simply joined the footprint.
Conclusion: this is not a leak, it is the allocator's high-water mark. WebKit's malloc grows the web process heap and never returns pages to the OS, and no API an embedder can reach changes that. The only true reclamation is ending the process.
So we end the process
The fix is architectural: PDF export now runs in a disposable, invisible window. It renders the transcript, fetches and thumbnails the images, prints, and dies. Its web content process takes every retained byte with it, by construction. The main window never touches the heavy work at all.
Simple idea. Shipping it surfaced three operating-system behaviors in one day, each found by a real person using the app while every automated gate was green:
- macOS suspends a hidden window's web process about ten seconds after page load. Mid-loop, silently: our image pipeline froze at the same wall-clock moment every run, process alive, memory frozen byte-identical. Visibility tricks changed nothing. What does wake a suspended page is an incoming script evaluation, so while an export runs, the app pings the runner with a no-op eval every two seconds. Yes, really.
- Hauling images through IPC was the wrong transport anyway. Each photo was crossing the Rust-to-JS bridge as a multi-megabyte base64 string. The runner now streams files through the asset protocol straight into
createImageBitmap, which also gives deterministic decode-memory release viabitmap.close(). A photo-heavy export that previously never finished now takes 17 seconds. - Destroying the window does not end its process. WebKit parks it in a reuse cache: three exports left three 100 MB corpses in Activity Monitor. Teardown now reads the web process pid, kills it while the view still owns it, destroys the window, and then sweeps the small stray processes window churn leaves behind, attributing them with the same responsibility API Activity Monitor uses for its process nesting.
Did it work?
Field-confirmed on the 84,000-message archive: the export helper appears, peaks at 374 MB, and is gone when the export ends, while the main app sits under 100 MB. From 7 GB at the start of this story to that.
The meta-lesson repeats from the last chapter, so it is probably the thesis of this whole series: every one of these behaviors was found by a person with a real phone and a real Activity Monitor, minutes after a fully green test suite said we were done. Automated tests verify your assumptions. Reality attacks the ones you did not know you had.